Real-time data insights are crucial for decision-making and operational management in the modern data-driven business environment. To visualize this data, Google Looker Studio, formerly known as Google Data Studio, is the most popular tool for data visualization due to its ease of developing customized dashboards and reports. At the same time, Jira is a crucial project management and issue-tracking tool for teams to standardize their workflow, track the status of their work, and assign tasks efficiently.
While Jira is the tool of choice for task management at the daily level, it might be hard to read the raw data and assess the performance as a whole or to search for trends. That’s where Google Looker Studio comes in. With Looker Studio, you can sync Jira, no matter the size of your boards or the number of project members, and create eye-catching, real-time reports that provide a full picture of how your projects or team members are performing.
This post will serve as a complete guide on the requirements, steps, inputs, and queries needed to fully utilize the Jira and Google Looker Studio integration.
Understanding the General Concept of Jira & Google Looker Studio
In big companies, it is very rare to find a project without any mention of Jira, the biggest project management and issue-tracking tool. A single platform for recording tasks, defects, or other issues can help companies to become more collaborative, keep the workflow of projects efficient, and turn project management into a transparent and open process. Teams can monitor the task status by using it as a progress reporting tool, implement the workflow that fits their business goal, and generate actionable reports to help executives make better decisions by keeping track of the project status.
Looker Data Studio is an advanced web-based platform for data exploration and visualization built for enterprise businesses. This platform allows businesses to explore, analyze, and visualize their data on the fly so that decision-makers have useful information. With Looker Data Studio, dashboards, reports, and visualizations can be easily created to give the full picture of business performance. Using this platform, businesses can be able to learn new trends, find out which parts of business need optimization, and create a business culture of data-driven decision making.
Why Connect Jira to Google Looker Studio?
Before diving into the technical aspects surrounding the integration, it’s important to understand the potential reasons for combining Jira with Google Looker Studio.

While each tool offers valuable insights on its own, combining them gives a bigger picture of the data surrounding the project you’re working with, which is why the relationship is beneficial. Here are reasons why the connection is crucial:
Improved Information Display
Although you can define dozens of custom fields in Jira and generate massive volumes of valuable data, it’s often difficult to see and share all this information without extracting it. Fortunately, simply by connecting a native Jira data source to Google Looker Studio, you can present your team with easily interpretable and shareable charts, graphs, and dashboards.
Simplified Documentation
But Google Looker Studio’s ability to report in real-time and customize can be used to create dashboards focusing on exactly the data you want to see – sprint progress, percentage of tasks completed, the productivity of your team, time to complete projects, and so on.
Enhanced Cooperation
One of the most compelling features of Google Looker Studio is the potential for teams to share a dashboard using live reports rather than emailing and sharing reports manually. By giving them links to live dashboards, you can ensure that all of your team members and stakeholders see the same information.
Unique KPIs & Metrics
Using Google Looker Studio, you can create reports that track KPIs and custom metrics specific to your group or company. With the level of customization possible, you can zero in on the metrics relevant to your company, such as task time tracking, sprint velocity, or identifying bugs.
Automatic Data Update
After being integrated, Google Looker Studio can pull data from Jira without additional effort, keeping your reports up-to-date. It means you’ll always be able to check your progress without taking the time to update the data manually.
Exploring Requirements for Proper Integration
There are some configurations and tools that need to be set up before you can connect Jira and Google Looker Studio. In order to connect these two platforms, you need an active Jira account with the right permissions, a Google Looker Studio account, and a third-party connector.

Due to the fact that Looker Studio and Jira can’t natively integrate with each other, there needs to be a third-party connector that transfers the data from Looker Studio to Jira. These connectors include Supermetrics, Power My Analytics, and the Google Sheets API. Once those tools are plugged in, you can extract the data from Jira and import it into Looker Studio to run reports and provide insights. Let’s dive into more details concerning these prerequisites:
Selecting & Installing a Third-Party Connector
It’s important to choose the appropriate connector for an integration to work. Still, there are plenty of popular solutions when it comes to tools that enable easy Jira integration: automatic data synching and creating your own report formats with just a few clicks. Common data objects include issue types, project statuses, and team performance indicators, but many others are supported, too. The connectors are easy to use as well.
Some teams might use the Google Sheets API instead if they’re looking for manual data support or if their budgets are tighter. When using this method, data is exported from Jira to Google Sheets, and this open-sourced spreadsheet application can be used as a bridge to Looker Studio.
- Employing EverythingData.io As a Third-Party Connector
Using Jira with EverythingData.io to get data into Google Looker Studio is a great way to visualize project management data and automate your data flow, enabling better reporting and real-time insights.
The first thing you do is open an account with EverythingData.io. From the list of connectors, pick Jira. If you have it set up one way or another to use either API keys or your Jira credentials, go ahead and sign in or use those keys. It’s very easy.
When you complete the Jira integration, your Jira account will be linked, and you will select which data fields (e.g., bugs, sprints, or backlog items) you would like to import. EverythingData.io will then help you connect and set up Jira and Looker Studio so that you can create your own dashboards and reports with your project performance metrics.
Using EverythingData.io, you can see the status of your sites, schedule reports, and bring in data from Jira and other sources to better understand your processes in Google Looker Studio.
Authorizing Access to Jira
Then, select a connector to allow access to your Jira data once you’ve decided on one. To do this, log into the connector and enter your Jira log-in information. The connector can be permitted to pull information from specific projects, specific problems, or specific custom fields.
It’s important to restrict the view of the connector to the information your reports need and only the information your reports need. This helps ensure the data you import into Looker Studio is relevant and secure.
Configuring Jira Data for Looker Studio
After the connector has been approved, you may set up the data ingestion into Looker Studio. Doing so involves selecting the Jira issues, projects, issue types, statuses, and custom fields you want to track.
If you want to track issue resolutions, sprint pace, or team workload, it’s important to focus on the key metrics that your team should pay attention to. Carefully selecting the data can help you produce succinct reports and keep the insights at the forefront of your company’s mind.
Building Custom Dashboards and Reports
You can customize dashboards and reports in Google Looker Studio using your data in Jira.
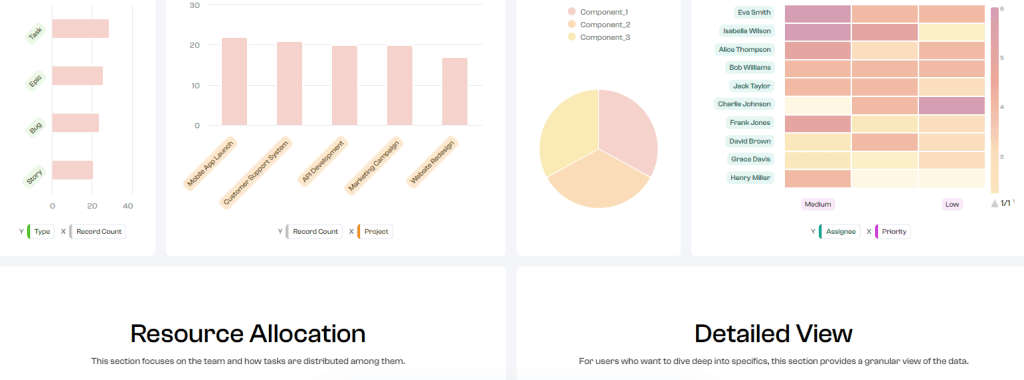
Looker Studio allows you to view your data in different ways using its collection of interactivity, graphs, and chart types (e.g., you can create line charts to see the progress of the sprint, a bar graph to see the project deadline, and a pie chart to demonstrate the distribution of problems).
Using Looker Studio’s customization features, you can customize your reports depending on the needs of your group or company.
Automating Data Syncing and Sharing Reports
At the highest level, the Jira-Google Looker Studio plugin’s automated data syncing enables this functionality. Most third-party connectors allow for injecting data refreshes on a schedule, so you’re assured that your reports will be refreshed without any human interaction.
You can also provide your stakeholders or team members with shareable links or embed the reports in other places for visibility. Because of this automation and collaboration, everyone in your company will always have access to the most current information.
How to Connect Jira to Google Looker Studio: A Step-by-Step Guide
It’s crucial that we have a full understanding of the stepwise procedure involved in fully connecting these entities. Below is a table giving us full insights on the process of integration:
| S/N | Steps | Descriptions |
| 1 | Log in to Jira | Log into Jira using credentials. Ensure you have permission for data to be displayed. |
| 2 | Selecting a Connector | The connector will aid the integration, and you will need a third-party connector like Supermetrics, Power My Analytics, or Google Sheets API. |
| 3 | Install the Connector | Then, just plug in the connector of your choice and follow its instructions for setting it up, which usually require you to set up a Google account. |
| 4 | Grant Access to Jira | Give the connector the access to your Jira data it needs. You will need to log into Jira to provide the connector with access to specific projects. |
| 5 | Set Up Information | Specify what information will be extracted from Jira. Choose teams, custom fields, problem types, task statuses, and projects that will be involved in your report. |
| 6 | Open Google Looker Studio and log in | Launch Google Looker Studio, then log in with your Google credentials. |
| 7 | Linking the Data Source | Click Create Data Source on the left panel of Looker Studio, then select the installed connection (for example, Supermetrics or Google Sheets) and link a data source to Jira. |
| 8 | Create a Report | If you’re using Google Looker Studio, go to “Create” → “Report”, where you can create a new report in Looker and use the associated Jira data to add charts, tables, and graphs. |
| 9 | Tailor the Images | Select graphical elements to be used in your report, such as pie charts, bar charts, or line graphs. Labeling of columns and lines, color schemes, and styles can be altered to suit your taste. |
| 10 | Sync Data Automatically | Saving changes to Jira in real time. By default, your connector refreshes data every 24 hours. However, if you want your channel to display real-time changes in Jira, then schedule data refresh as frequently as needed in your connector settings. |
| 11 | Distribute Your Report | Once the report is completed and published, you can either click ‘Share’ to create a link or share it with specific people or groups to keep your team informed with the latest information. |
| 12 | Examine and Repeat | You should continue to check your report to ensure it’s accurate and relevant to your needs. As your project needs to change, you might want to add more data fields, change the filters, or change the graphics. |
It’s important to note that most connectors allow you to select the data fields (such as the percentage of tasks completed, the percentage of sprints completed, the time logged, the percentage of tasks assigned to my team versus other teams, etc.) that you would like to import.
Targeted, valuable dashboards built with data from these tools require you to customise them to deliver the right information without overwhelming the user.
Best Practices for Enhancing Proper & Adequate Integration
A couple of best practices that could help you get the best of it include connecting small quantities of data to your dashboards. Import all essential pieces of data, but make sure that the visualizations you include are relevant to your KPIs and provide real value.
Utilise segmentation functionalities and custom filters to adapt your reports to your audiences: what might apply to executives might be useless to developers, and vice versa. Make your reports visually appealing and easy to read so that your team members can understand what is going on and make the right decisions in the shortest time possible.
Bringing It All Together: Your Guide to Integrating Jira and Google Looker Studio
Integrating Jira with Google Looker Studio (Data Studio) on your own is a nice way to supercharge the level of data visualization that you do for your projects. In fact, by using this integration, you can take unstructured project data and turn it into actionable knowledge, leveraging both data-driven decision-making and performance monitoring approaches in your team.
You can use the Google Sheets API, Power My Analytics or even a Supermetrics third-party connector (while it is still available) for this integration process. It is fast and easy and definitely worth your while. With the right configuration and settings, you can really make the most of your Jira data and ensure that your team gets the insights they need on time.

